Showing posts with label Resistance. Show all posts

Wednesday, September 10, 2014

Reliance Capital: A View


After, Modi coming up with new banks license in India all the trader in the stock market are having a keen interest on the stock which is getting the banking license. Among which we have Reliance who is a big player and the chance of getting the permit is very high.

Technical Perspective
The stock is showing the divergence and we can see a falling wedge pattern . On 9th September 2014 the stock had given the positive breakout and the on 10th September 2014 i.e today the stock had shown a Doji. And we can see the can open with a positive note tomorrow. If not; the stock can end up falling to 500 which is the immediate support. And 577 and 670 are the good resistance. The stock has a potential to make a new high.


Additional Observation
The stock is showing negative correlation from last 6 months and we have to see that the patter will continue or the old pattern will repeat


Friday, January 3, 2014

Trading Sintex Ind's Ascending Triangle

As per the observation the stock had performed well in market. From last September 2013, now the stock is giving clear indication of a continuation and the stock price is expected to move up to 43/52 which are the next potential resistance.


The RSI is above 70 and making a bearish divergence thus forming the stock as a risky trade and can be advised to traders with quick entry and exit strategy. 

Sunday, April 14, 2013

A Falling Wedge in Sensex


We have seen market consolidating, these days. The cocktail of negative news have driven market near to 18000 levels. Before it reach 18000 we are seeing falling wedge pattern forming. 
A Falling Wedge

A Divergence Building up 

Simultaneously, we are seeing a Bullish Divergence forming in market. As we are seeing a gap filling have started up in Sensex. We may see a reversal @18000 level after filling up of gap; which will eventually lead to a bullish breakout in Falling wedge.


Important SAR

Thursday, December 20, 2012

ITC, How long to correct?

We have seen negative divergence due to which the stock have started its consolidation phase. 


Sunday, December 16, 2012

Technical Analysis on IVRCL Ltd

On 3rd December I had had told my opinion on my page Experiments With Stocks, The stocks went up to  +9% and gave a bearish engulfing. the price is currently ruling around 42. I was away from this stocks but a sudden Harami drew my attention.


According to me the stock have a potential to go upto 47. If it show a reversal know. If not the stock have a  support at 39.

Sunday, September 23, 2012

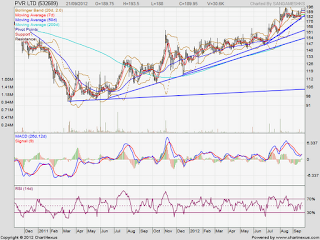
Analysis on PVR Ltd


PVR Ltd is a technically sound company. It is on a bullish trend since June 2011. In spite markets ups and lows the stock had performed well with respect to market.

 The reasons are as follows:
  •              Candle-Stick Pattern: we have seen a Morning Star on last Friday.
  •       Indicators & Divergence: MACD is about to give a Bullish Cross-over. Along with that we are seeing a Bullish divergence. And RSI is neutral.
  •       Moving Averages: All the moving averages are giving a clean way for this stock to sore high. We have seen a golden crossover in September 2011.
  •        SAR: we have seen a recent resistance turning as a support @188. The next resistance is at 203 and so on.
  •      Chart Pattern: From July 2012 we have been seeing this stock making a Bump and Run Continuation. According to me we are expected to see a 2nd Bump and Run Continuation.


·         Conclusion: This stock was bullish for a year and it is showing a continuation. The stock is on a bullish run will continue not more that 3-6 months. The stock is at high and expected to make a higher high.

Sunday, March 18, 2012

SENSEX: Some Interesting Facts


From very long days this support is working very crucial all the time. Before market makes a big move we have seen this type of violation as I have pointed it on my charts. I am bullish on market until the market maintains a bullish trend. Recently MACD was unable to give a positive signal, yet I am bullish because I feel market is likely to follow trend line.